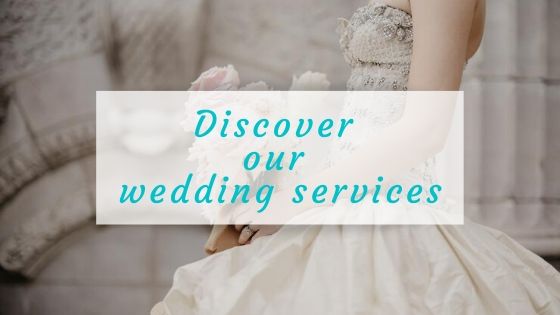
We like creating your perfect wedding in Italy: your ideas and your expected budget combined with our experience!
Our clients have busy and demanding lives, so our role is to help you enjoying planning from start to finish avoiding any kind of emotional stress. Whether you require a complete full planning service or simply a day co-ordination, we are here to help!
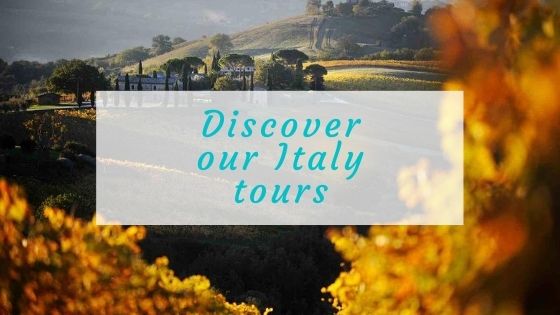
We continuously select elegant venues in the most famous and evocative sceneries of Italy such as historic buildings, castles, country houses, terraces overlooking the sea, lush gardens. We will enrich your wedding day with exciting food expertly presented, and accompanied by a fine selection of wines to stimulate the palate of your guests. The experience and grandeur of Italian cuisine will leave everyone speechless!
Elegant floral designers, artistic and expert photographers, refined hair and makeup artists, prestigious wedding favors, humorous photo booth… No matter what kind of professional or service you are looking for, we have what’s right for you!
We can arrange a civil marriage, a religious wedding, a symbolic ceremony or a simple blessing. We will help you acquiring legal papers according to the nationality of the bride and groom and the type of ceremony requested.